ProSBC Processor Usage
This procedure is used to check the Processor usage of the ProSBC.
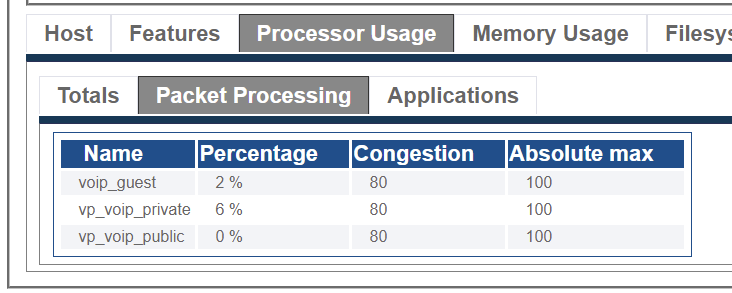
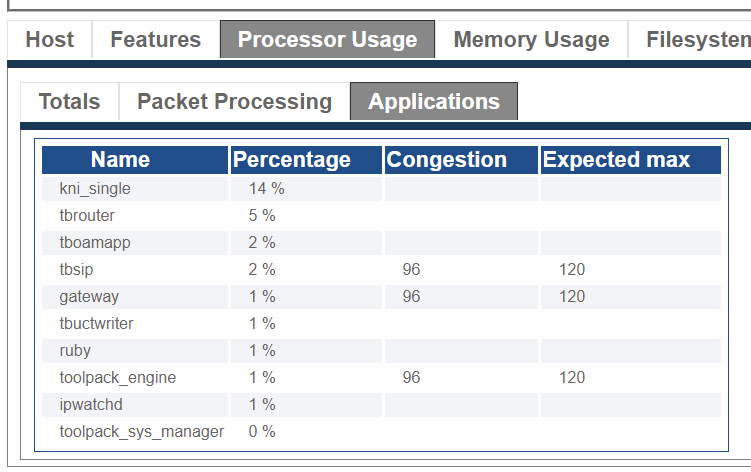
How to check processor usage from the web portal
From the web interface you can see the processor usage:
Hosts -> Status -> Select Host -> Processor Usage tabTotals view show the global processor usage, and processor usage divided between applications and SBC processing

Packet Processing shows processor usage of each IP interfaces

Applications shows the processor usage of the individual applications and their theoretical maximums

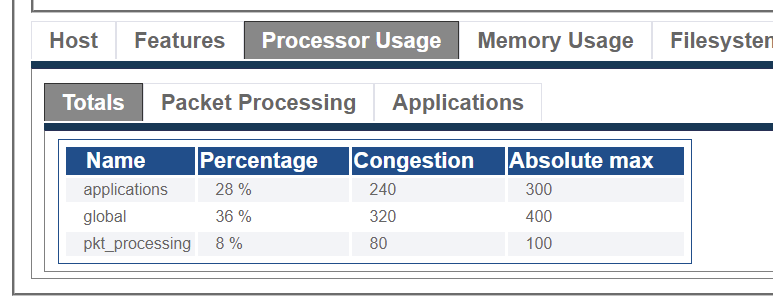
Processor usage from SNMP
You can retrieve the processor usage from SNMP GET, using the TB-MIB TelcoBridges enterprise MIB. The value is located in the tbSwPerfTable (OID: 1.3.6.1.4.1.21776.1.2.2.3)
Periodic logs on processor usage
Processor and memory usage are logged on the system. You can get access to these logs in this folder:
It is also available in the TBReport
Accessing from the console
From the SSH access, here are the available commands. With the top command you can see the total CPU usage (and Memory usage) of the host:
Here we see the processor usage is 70% idle. We also see the tbrouter application is at 101% CPU, which is normal. You can have more details here: Toolpack_Application:tbrouter
Last updated
Was this helpful?
